01
Image
Like physical fitness, financial fitness can be measured in a myriad of ways.
That’s exactly why the work of John Molenhuis, business analysis and cost-of-production specialist for the Ontario Ministry of Agriculture, Food and Rural Affairs (OMAFRA) is so valuable. He’s worked with the grape, tender fruit and apple groups for years, updating baseline measurements every five years that compare the average of the group to the top 25.
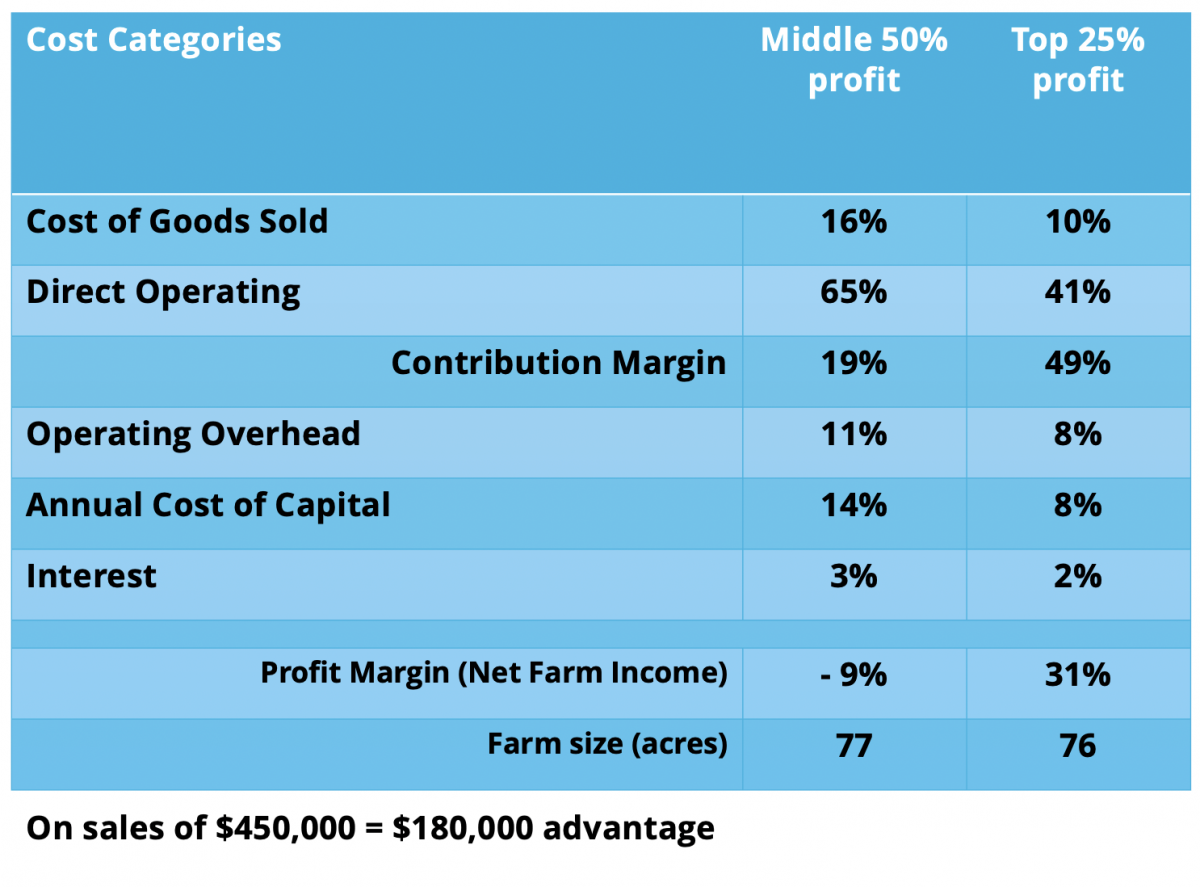
| Grapes: Top vs Mid Profit Results |
 |
“The biggest reason for this production systems approach is that the data can be used as a planning tool,” explains Molenhuis. “Each individual can springboard from that data to decide on different varieties or replant strategies to improve profitability.”
A new initiative using the Ontario Farm Income Database and Business Risk Management program data is developing financial benchmarks to help farmers measure their financial fitness.
Currently, benchmarks for 13 farm types are available including grapes.
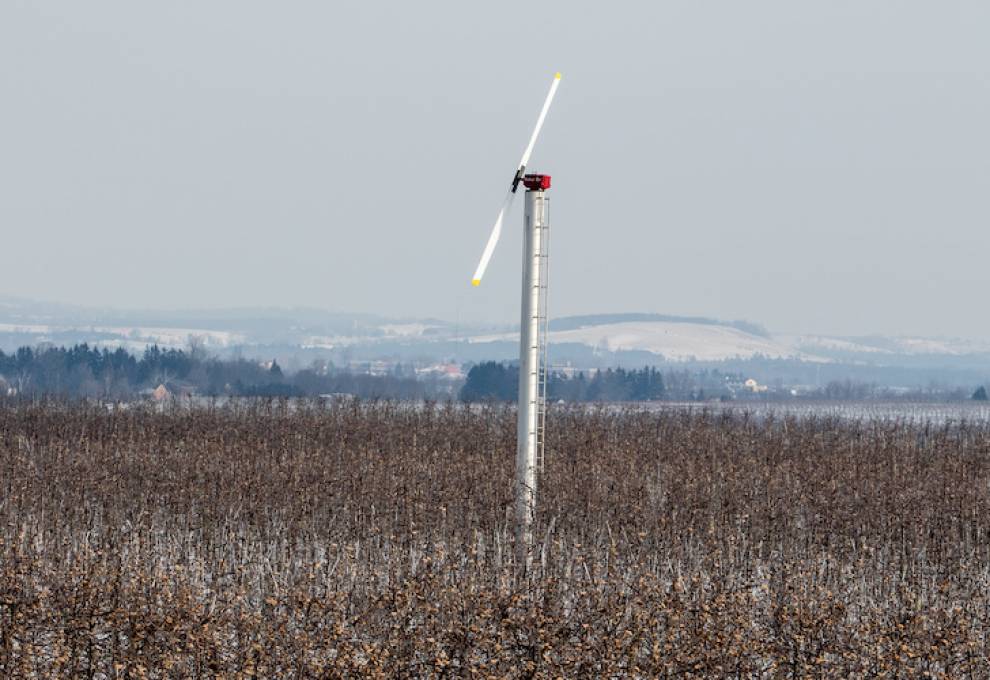
Analysis of Ontario’s grape sector is particularly robust with an average of 120 farms per year in the data over the last five years. Molenhuis presented results at a recent webinar called: “Vineyard profits: how do you measure up?” “Farm size is not the biggest factor in determining profitability,” explains Molenhuis. The average size of the Ontario grape vineyards in the data is 74 acres. The top farms have virtually the same number: 76 acres. As the data show, it’s about who does the best job of deploying their physical assets, labour and financial capital.
Here are five of the financial benchmarks.
1. Direct operating costs. Labour is expensive. This line item comprises a large proportion of the input costs in horticulture. In the grape sector study, farmers are spending 30 per cent of their revenue on labour whereas the top 25 out of 120 farms are allocating 20 per cent of their revenue. Why the big difference? These farmers are getting higher yields, higher revenues.
2. Cost of goods sold. Fertilizer, seed and crop protection products fall into this category. On average, grape farmers are spending 16 per cent of their revenue on these costs, whereas the top 25 farmers are spending only 10 per cent.
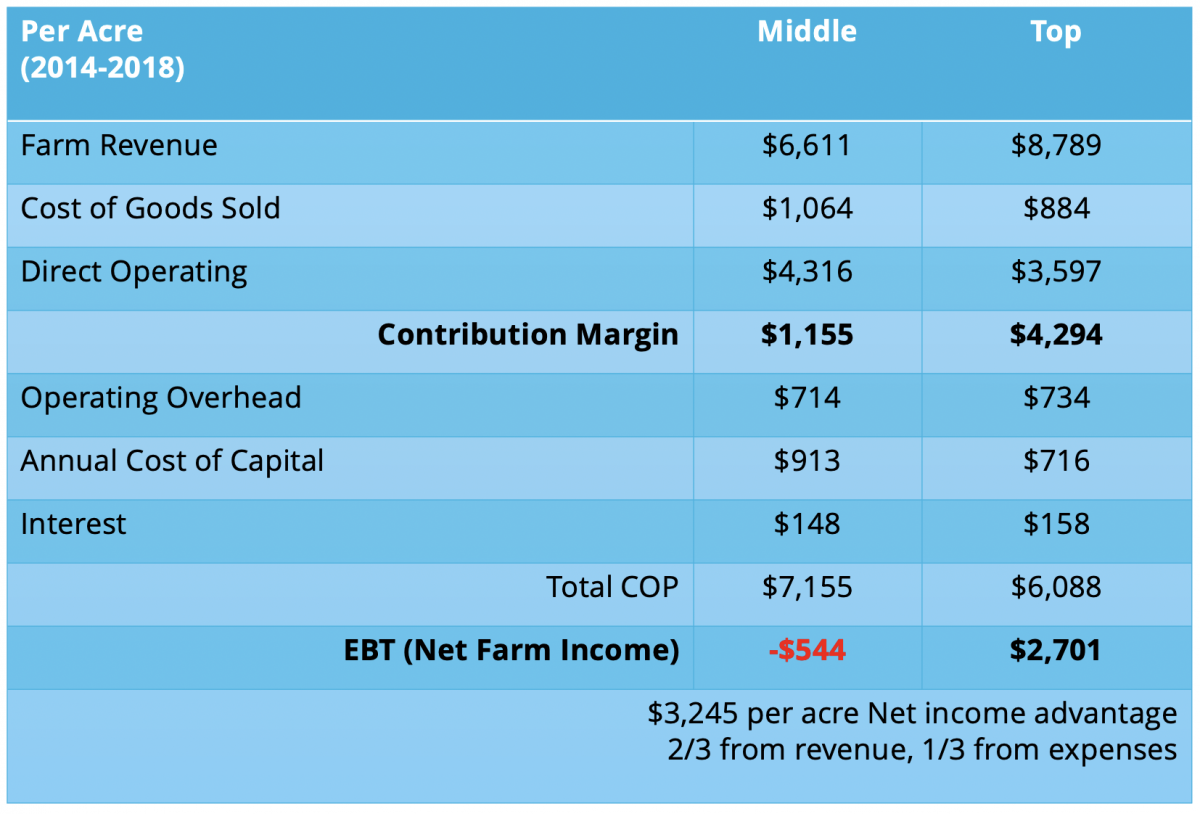
| Measuring up: Knowing your cost of production |
 |
3. Capital costs. This line item includes depreciation, rent and taxes. It’s an indicator of how efficiently farmers are accessing and deploying capital. On average, grape farmers are spending 14 per cent of their revenue whereas the top 25 are spending eight per cent.
4. Interest costs. On average, grape farmers are spending three per cent of their revenue on interest costs whereas the top 25 are spending one per cent.
5. Direct operating costs. This category includes machinery, fuel and labour. On average, grape farmers are spending 65 per cent of their revenue to operate whereas the top 25 are spending 41 per cent. Why the difference? Perhaps the most efficient growers are automating more than their neighbours.
Efficiencies can be gained by either increasing revenues or cutting costs – or both. For the top 25 grape growers, Molenhuis found that two-thirds of their financial advantage came from revenues.
“Cost control is important, but achieving higher yields and earning higher prices were also drivers of success,” says Molenhuis.
While cost of production analysis requires meticulous record-keeping, it’s a reliable indicator of financial health. The 2020 pandemic year will no doubt reveal spikes in expenses but also the buffer of both federal and provincial funds to offset those unusual costs of personal protective equipment and worker accommodations. In the future, an analysis should show how effectively farmers tapped into those resources to steer through the crisis.
Standard (Image)

Add new comment